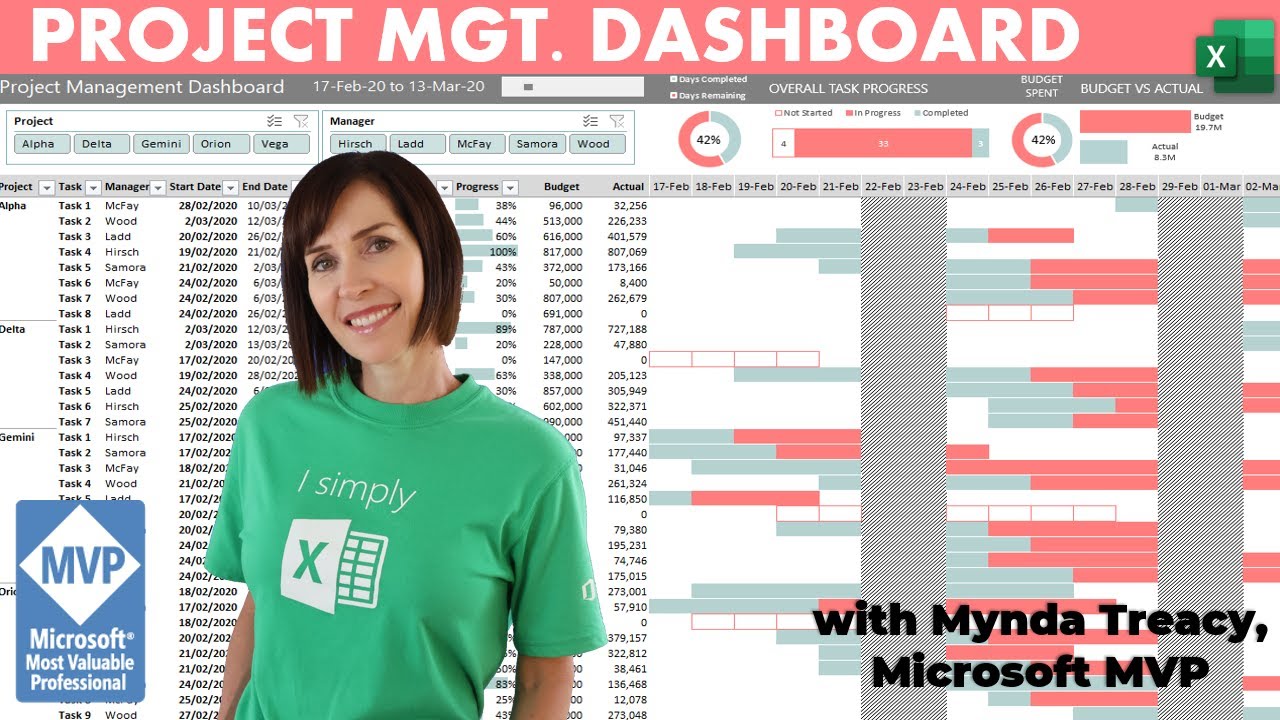
Interactive Excel Project Management Dashboard - FREE Download - My Online Training Hub
video description
Date: 2022-04-08
Related videos


Comments and reviews: 10
Cornelia
Hi, Thank you so much for this great tutorial. With your help I managed to create a dashboard customized for my needs.
However, one important point has not yet succeeded and I hope you can give me a tip:
Is there a way to create a -slicer- that allows me to hide the completed tasks in the pivot table? I tried to use the progress slicer, but in the worst case this shows hundreds of values... Best would be if I could choose between -not started-, -in progress- and -completed- -- analog to the overall task progress chart
reply
Hi, Thank you so much for this great tutorial. With your help I managed to create a dashboard customized for my needs.
However, one important point has not yet succeeded and I hope you can give me a tip:
Is there a way to create a -slicer- that allows me to hide the completed tasks in the pivot table? I tried to use the progress slicer, but in the worst case this shows hundreds of values... Best would be if I could choose between -not started-, -in progress- and -completed- -- analog to the overall task progress chart
reply
Gagan
Hi Tracy Mam could you please explain me video timing 33: 51 formula , with and formula date 17 Feb Is greater than 28 Feb so this condition is false , second weekday function why at last 1 is deducted & this is greater than date is 17 Feb that true condition ....so first condition is false & second condition is true so the result will be false .... please explain me it to me
reply
Hi Tracy Mam could you please explain me video timing 33: 51 formula , with and formula date 17 Feb Is greater than 28 Feb so this condition is false , second weekday function why at last 1 is deducted & this is greater than date is 17 Feb that true condition ....so first condition is false & second condition is true so the result will be false .... please explain me it to me
reply
JoRands1
Been following this tutorial thanks so much. I have a question around the Overall Task Progress. My slicer is not linked to the data in a pivot like the other pivot charts. So when I click through the slicer on the main page, those values are not changing. Did you skip the step when you showed this?
reply
Been following this tutorial thanks so much. I have a question around the Overall Task Progress. My slicer is not linked to the data in a pivot like the other pivot charts. So when I click through the slicer on the main page, those values are not changing. Did you skip the step when you showed this?
reply
Adilet
This has been so helpful! Thank you so much! I only have one question - i didnt account for growth, and now i have to add new tasks in my source/data table. How and where do i extend my formulas for my new inputs so they can be shown on my Pivot table. If anyone could help I will be forever grateful!
reply
This has been so helpful! Thank you so much! I only have one question - i didnt account for growth, and now i have to add new tasks in my source/data table. How and where do i extend my formulas for my new inputs so they can be shown on my Pivot table. If anyone could help I will be forever grateful!
reply
Morten
Hi Mynda! Very cool dashboard and videoexplanation. Is it possible to make a vertical date-line from top to bottom of the calender so its quick visualized what day it is and where the tasks should be whenever the sheet is oppened?-
Again excellent job from you, thanks!
reply
Hi Mynda! Very cool dashboard and videoexplanation. Is it possible to make a vertical date-line from top to bottom of the calender so its quick visualized what day it is and where the tasks should be whenever the sheet is oppened?-
Again excellent job from you, thanks!
reply
Jack-D
I really enjoyed this and have to admit that I really venture into anything other than the most basic features of Excel. That will change as a direct result of watching this marvellous video. Thank you so much for your helpful and clear tutorial Mynda.
reply
I really enjoyed this and have to admit that I really venture into anything other than the most basic features of Excel. That will change as a direct result of watching this marvellous video. Thank you so much for your helpful and clear tutorial Mynda.
reply
Siddiq
How is the formula for determining progress percentage written? Once the end date has passed, I am getting over 100% on progress when it should stay at 100%. I do know it is an IF(parameter>1,1) formula, but I can't figure out how to place it . :(
reply
How is the formula for determining progress percentage written? Once the end date has passed, I am getting over 100% on progress when it should stay at 100%. I do know it is an IF(parameter>1,1) formula, but I can't figure out how to place it . :(
reply
Chevy
Great video. Im just now learning pivot tablea. I'm worried about scalability. Let's say the data grows by 200% but we didn't extend our formulas down far enough. Is there a way to make this like a regular table and extend formulas automatically?
reply
Great video. Im just now learning pivot tablea. I'm worried about scalability. Let's say the data grows by 200% but we didn't extend our formulas down far enough. Is there a way to make this like a regular table and extend formulas automatically?
reply
Tarek
You are a top rated instructor , the way you talk and convey information is just amazing , clear and condense in a very smooth way . In this video I learned a lot and gave me idea to do my work easily thank you
reply
You are a top rated instructor , the way you talk and convey information is just amazing , clear and condense in a very smooth way . In this video I learned a lot and gave me idea to do my work easily thank you
reply
Erik
Mynda, amazing tutorial. I have been using spreadsheets back to the Visicalc days. Thank you for teaching an old dog some new tricks. Have you integrated task dates with Google calendars?
reply
Mynda, amazing tutorial. I have been using spreadsheets back to the Visicalc days. Thank you for teaching an old dog some new tricks. Have you integrated task dates with Google calendars?
reply
Add a review, comment
Other channel videos